Assignments for Class 10 Mathematics Statistics have been developed for Standard 10 students based on the latest syllabus and textbooks applicable in CBSE, NCERT and KVS schools. Parents and students can download the full collection of class assignments for class 10 Mathematics Statistics from our website as we have provided all Maths Assignment for Class 10 chapter wise free in PDF format which can be downloaded easily. Students are recommended to do these assignments daily by taking printouts and going through the questions and answers for Grade 10 Mathematics Statistics. You should try to do these test assignments on a daily basis so that you are able to understand the concepts and details of each chapter in your Mathematics Statistics book and get good marks in class 10 exams.
Question. The median and mode of a frequency distribution are 26 and 29 respectively. Then, the mean is
(A) 27.5
(B) 24.5
(C) 28.4
(D) 25.8
Answer
B
Question. If the mean and median of a set of numbers are 8.9 and 9 respectively, then the mode will be
(A) 7.2
(B) 8.2
(C) 9.2
(D) 10.2
Answer
C
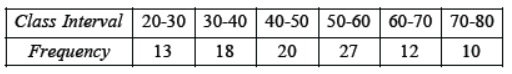
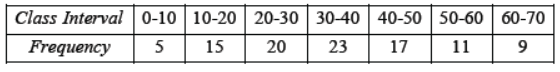
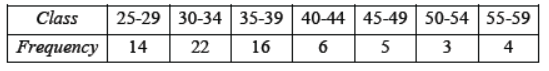
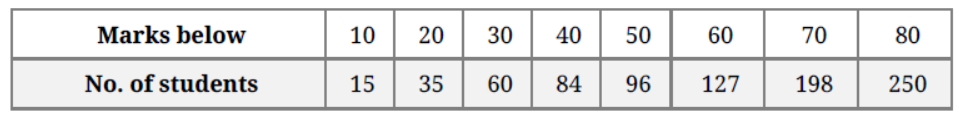
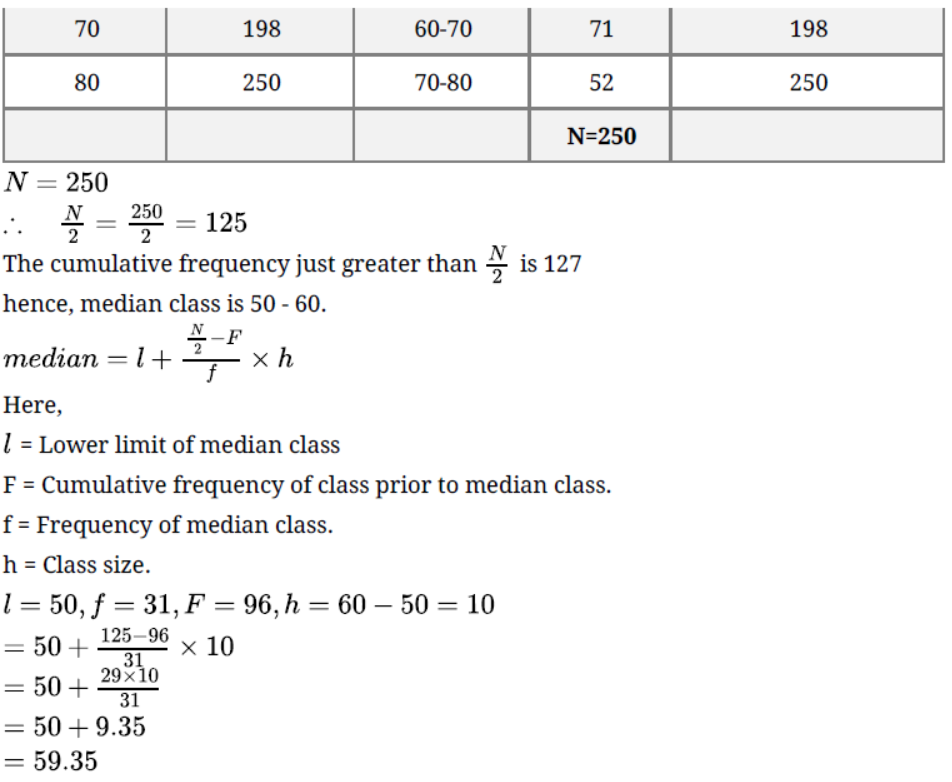
Question. Look at the frequency distribution table given below:
The median of the above distribution is
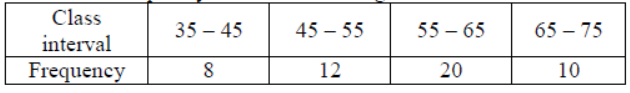
(A) 56.5
(B) 57.5
(C) 58.5
(D) 59
Answer
B
Question. Mode = ?

Answer
B
Question. For a symmetrical frequency distribution, we have
(A) mean < mode < median
(B) mean > mode > median
(C) mean = mode = median
(D) mode = 1/2 (mean median)
Answer
C
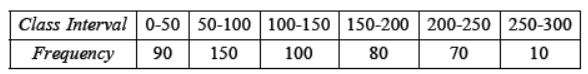
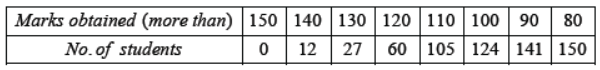
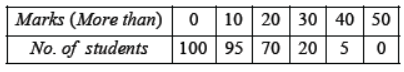
Question. Look at the cumulative frequency distribution table given below:
Number of families having income range 20000 to 25000 is
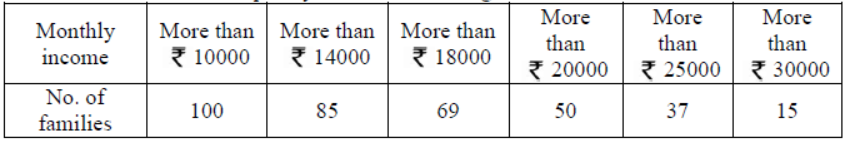
(A) 19
(B) 16
(C) 13
(D) 22
Answer
C
Measure of Central Tendency
Mathematical Calculations
Mode
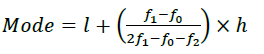
Where,l= lower limit of the model class, h=size of the class-interval,
Where, lower limit of the model class, size of the class-interval,
f1= frequency of the model class,f2=frequency of the class, preceding the modal class,
f2=frequency the modal class,h=class size.
Median
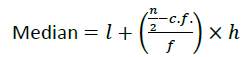
Where,
l=lower limit of the median class
n=number of observations,
c.f=cumulative frequency if the class preceding the median class,
f=frequency of the median class,
h=class size.
Mean

Graphical Representation
Cumulative Frequency Graph
Less than Ogive
More then Ogive
All the formulae discussed are for grouped data calculation for ungrouped data have been done in previous class
The three measures mean, mode and median are connected by the following relations.
Mode = 3 median – 2 mean
Short / Long Answer types Questions :
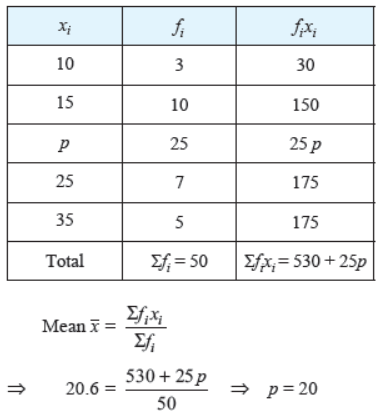
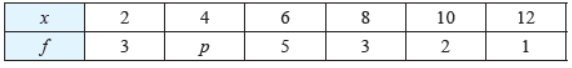
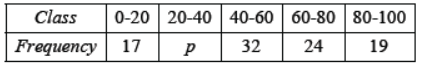
Question. If the mean of the following data is 20.6, find the value of p.
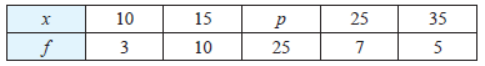
Solution.
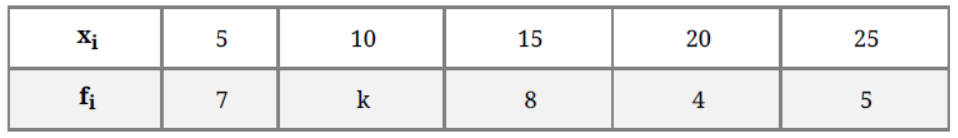
Question. The following distribution shows the daily pocket allowance of children of a locality. The mean pocket allowance is ` 18. Find the missing frequency k.

Solution. k = 8
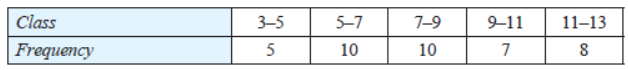
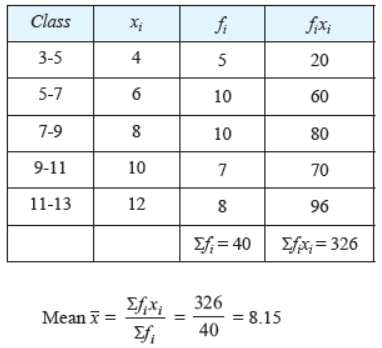
Question. Find the mean of the following data:

Solution.

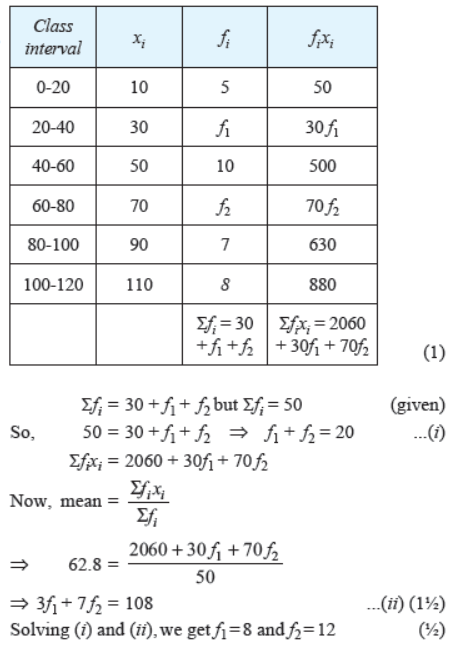
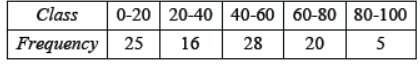
Question. The mean of the following frequency distribution is 62.8 and sum of all frequencies is 50. Find the missing frequencies f1 and f2.

Solution.
Question. The table below shows the daily expenditure on grocery of 25 households in a locality.
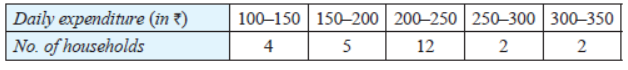
Find the mean daily expenditure on food by a suitable method.
Solution.


Question. The following distribution shows the daily pocket allowance of children of a locality. The mean pocket allowance is ` 18. Find the missing frequency f.

Solution.

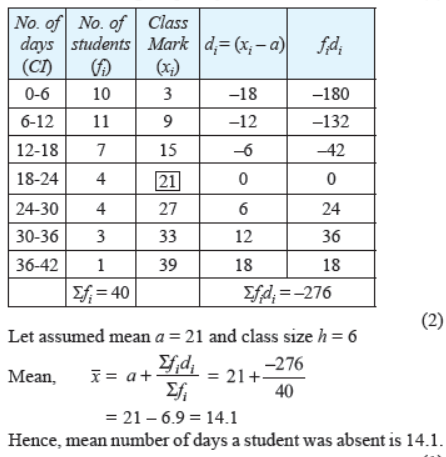
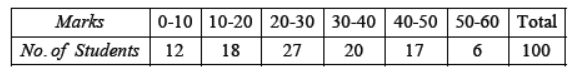
Question. A class teacher has the following absentee record of 40 students of a class for the whole term. Find the mean number of days a student was absent.

Solution.
Question. Find the class-mark of class 25–35.
Solution. Class-mark = 25 + 35/2 = 60/2 = 30
Question. Find the mean of first ten odd natural numbers.
Solution. 10
Question. If the mean of the first n natural number is 15, then find n.
Solution. 15 = 1 + 2 + 3 + … + n/2

Question. Find the mean of the following distribution:
Solution.
Question. Find the mean of the following distribution:

Solution.

Question. Find the class-marks of the classes 10-25 and 35-55.
Solution. Class-mark of class 10 – 25
= 10 + 25/2 = 35/2 = 17.5
Class-mark of class 35–55
= 35 + 55/2 = 90/2 = 45
Question. The mileage (km per litre) of 50 cars of the same model was tested by a manufacturer and details are as follows:
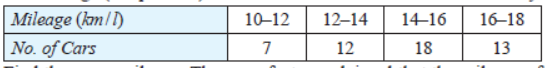
Find the mean mileage. The manufacturer claimed that the mileage of the model was 16 km / l. Do you agree with this claim?
Solution.
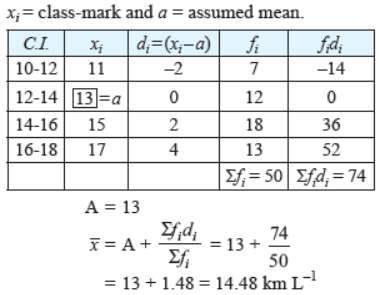
Hence, mean mileage of car is 14.48 km/litre.
So, the manufacturer’s statement is wrong that mileage is
16 km L–1.
Question. The arithmetic mean of the following frequency distribution is 53. Find the value of k.

Solution.

⇒ 3340 + 70k = 53 (72 + k)
⇒ 3340 + 70k = 3816 + 53k
⇒ 70k – 53k = 3816 – 3340
⇒ 17k = 476 ⇒ k = 28
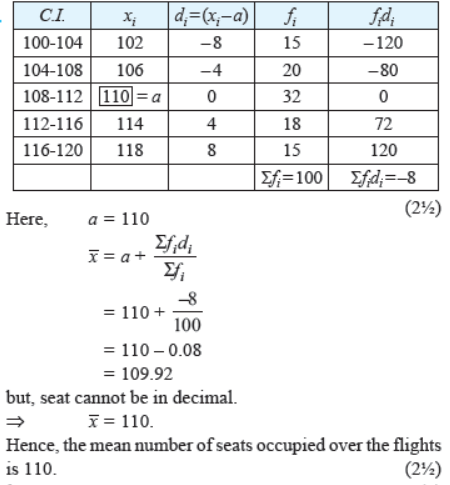
Question. An aircraft has 120 passenger seats. The number of seats occupied during 100 flights is given as follows:
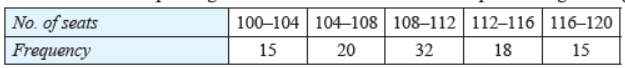
Determine the mean number of seats occupied over the flights.
Solution.
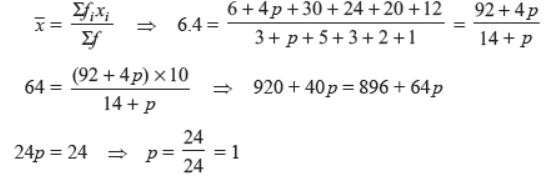
Question. If the mean of the following distribution is 6.4, then find the value of ‘p’.
Solution.
Question. Find the arithmetic mean of 1, 2, 3, …, n
Solution. We know that,

Question. The following data gives the information on the observed life-times (in hours) of 225 electrical components.
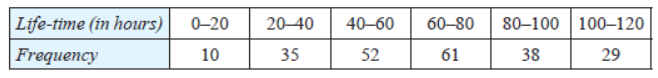
Determine the mean of the above data.
Solution.

PRACTICE EXERCISE
Question. Calculate the median for the following data :
Solution. 153.4
Question. Draw the ogive for the following frequency distribution :

Also, find the median using ogive drawn.
Solution. 37.5
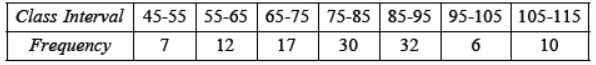
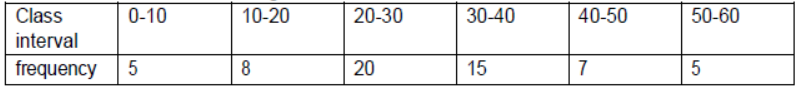
Question. Find the mean of the following frequency distribution :
Solution. 48.70
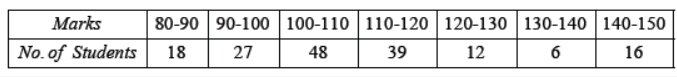
Question. Calculate the mode of the following data :
Solution. 77.27
Question. Calculate the arithmetic mean of the following frequency distribution :
Solution. 69.33
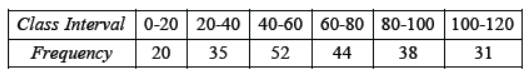
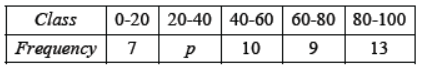
Question. The mean of the following frequency table is 50. But the frequencies f1 and f2 in class 20-40 and 60-80 are missing. Find the missing frequencies.
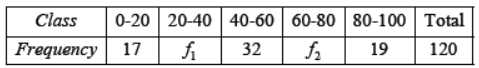
Solution. f1 = 28, f2 = 24
Question. The following table shows the weights in gm of a sample of 100 potatoes taken from a large consignment:
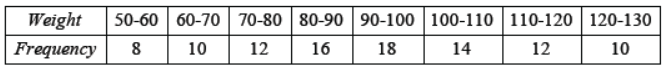
Draw the cumulative frequency curve and from it determine the median weight of the potatoes.
Solution. 93 gm
Question. The marks of 200 students in a test were recorded as follows :
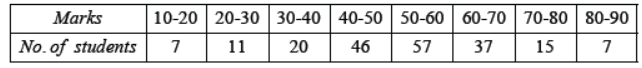
Draw the cumulative frequency table and ogive. Use it to estimate the median.
Solution. 52.8
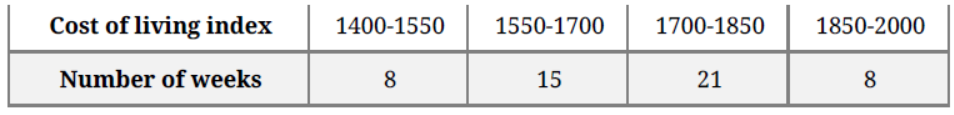
Question. The following table gives the distribution of expenditure of different families on education. Find the mean expenditure on education in a family.

Solution. Rs. 2662.5
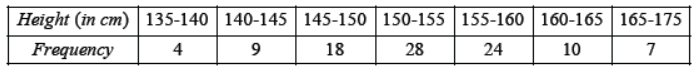
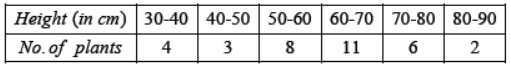
Question. Calculate the modal height from the following table

Solution. 153.57 cm
Question. Find the value of p if the mean of the following distribution is 7.5.

Solution. p = 3
Question. Find the mode of the following distribution :
Solution. 52
Question. Find the mean of the following frequency distribution :
Solution. 25.2
Question. Find the average marks scored by students of a class in a test from the following data :
Solution. 28 marks
Question. For the following frequency distribution, draw both the types of cumulative frequency curve on the same graph paper and hence find the median.

Solution. 75
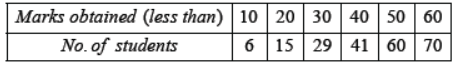
Question. Draw a ‘less than type’ cumulative frequency curve for the following data.
Hence, estimate the median.
Solution. 20
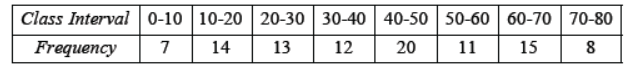
Question. Draw a cumulative frequency curve (less than type) for the following data and find the median from it.
Solution. 32.6
Question. Find the mean of the following distribution :
Solution. 19.92
Question. Calculate the mode of the following distribution :
Solution. 107
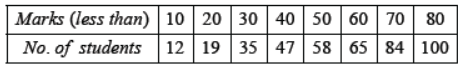
Question. The marks obtained by 100 students of a class in an examination are given below :

Draw a cumulative frequency curved by using : (i) ‘less than type’ and (ii) ‘more than type’. Hence find the meadian.
Solution. 28.8
Question. Compute the mode of the following data :
Solution. 85.71
Question. Calculate the mode from the following data :
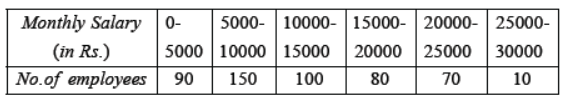
Solution. Rs. 7727.27
Question. Marks scored by 400 students in an examination are as follows :

Draw a ‘more than type’ cumulative frequency curve and from it determine the median.
Solution. 57.5
Question. Calculate the mean, the median and the mode of the following distribution :
Solution. Mean = 14.96, Median = 15, Mode = 15
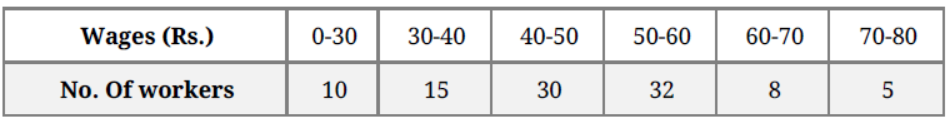
Question. The table given below shows the distribution of the daily wages, earned by 160 workers in a building site:
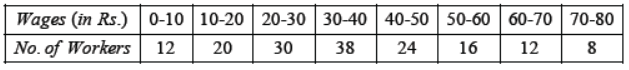
Draw a cumulative frequency curve by using : (i) ‘less than type’ and (ii) ‘more than type’.
Hence, estimate the median wages using graph.
Solution. Rs. 34.73
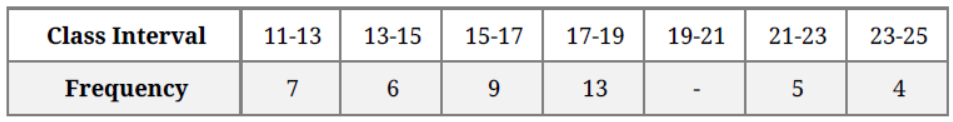
Question. Find the median of the following frequency distribution :
Solution. 27
Question. Find the mean of the following distribution :
Solution. 55
Question. Calculate the mode for the following frequency distribution :
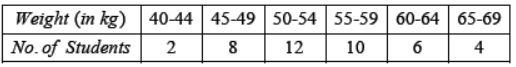
Solution. 52.83 kg
Question. Find the mean of the following frequency distribution :
Solution. 53
Question. Calculate the mean of the following frequency distribution:
Solution. 196.8
Question. The arithmetic mean of the following frequency distribution is 50. Find the value of p.
Solution. p = 28
Question. Find the mean of the following frequency distribution :
Solution. 50
Question. Calculate the median income :
Solution. Rs. 934.17
Question. Find the mean of the following frequency distribution :
Solution. 148.61
Question. Find the median for the following frequency distribution :

Solution. 35.76 years (approx).
Question. Find the mode for the following frequency distribution :
Solution. 63.75
Question. Find the average height for the following frequency distribution :

Solution. 153.45 cm
Question. Find the median for the following frequency distribution :

Solution. 153.64
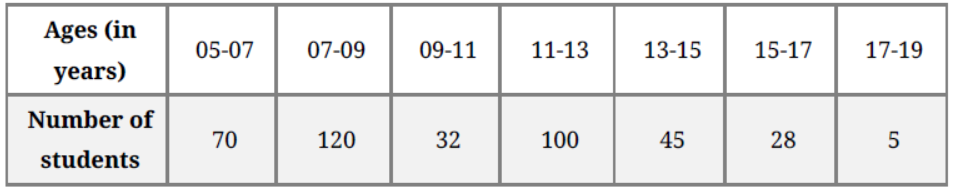
Question. The following table shows the ages of the patients admitted in a hospital during a year :
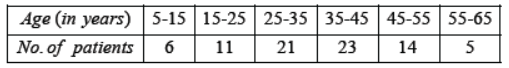
Find the mode and the mean of the data given above. Compare and interpret the two measures of central tendency.
Solution. mode = 36.81 years; mean = 35.37 years
Question. The following table gives the marks obtained by 50 students in a class test :
Find the median marks.
Solution. 33
Question. Calculate the mean of the following distribution :
Solution. 62.545
Question. The median of the following distribution is 35, find the value of a and b.

Solution. a = 35, b = 25
Question. Calculate the median for the following data :
Solution. 35
Question. Find the mode for the following distribution table :
Solution. 44.705
Question. Find the mode for the following frequency distribution :

Solution. 12.89
Question. Calculate the median for the following data :
Solution. 116.67
Question. Draw a cumulative frequency curve (more than type) for the following data and hence obtain the median.
Solution. 35 (approx)
Question. If the median of the distribution given below is 28.5, find the value of x and y.
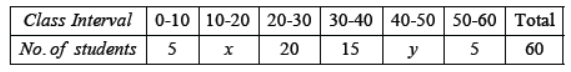
Solution. x = 8, y = 7
Question. If the mean of the distribution is 57.6 and the sum of its observations is 50, find the missing frequencies f1 and f2.
Solution. f1= 8, f2 = 10
Question. Find the mean of the following frequency distribution :
Solution. 36.357
Question. Compute the mean for the following data :
Solution. 24
Question. If the mean of the following distribution is 54, find the value of p :
Solution. p = 11
Question. The wickets taken by a bowler in10 cricket matches are as follows:2,6,4,5,0,2,1,3,2,3 Find the mode of the data.
Solution. 2
Question. How one can find median of a frequency distribution graphically.
Solution. OGIVE
Question. What is the mean of first ten prime numbers?
Solution. 12.9
Question. What measure of central tendency is represented by the abscissa of the point where less than ogive and more than ogive intersect?
Solution. MEDIAN
Question. What important information one can get by the abscissa of the point of intersection of the less than type and the more than type cumulative frequency curve of a group data.
Solution. Median
Question. Using the assumed mean method find the mean of the following data.

Solution. 27.2
Question. If the mode of a data is 45 and mean is 27, then median is .
Solution. 33
Question. Find the median of the following frequency distribution.

Solution. 167
Question. Given below is the distribution of IQ of the 100 students .Find the median of IQ
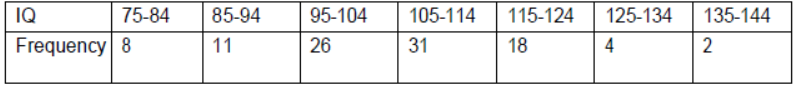
Solution. 106.1
Question. Find the median of the following distribution.
Solution. 28.5l
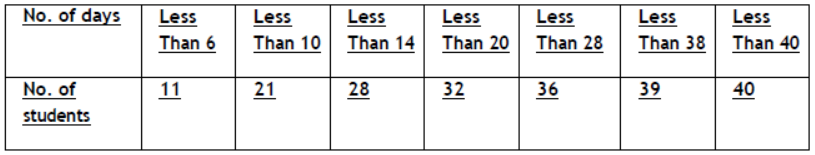
Question. A class teacher has the following absentee records of 40 students of a class for the whole term
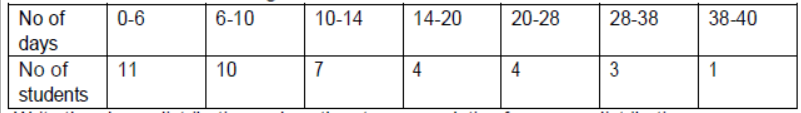
Write the above distribution as less than type cumulative frequency distribution
Solution.
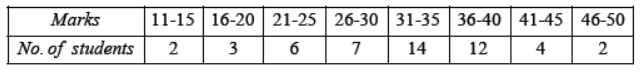
Question. Find the mode of the following

Solution. MODE =40
Question. Name the key terms used in central tendency
Solution. Mean, Median, Mode
Question. Draw cumulative frequency curve for the following data :

Hence, determine the median.
Solution. 32.5
Question. Compute the mean for the following data :
Solution. 43
Question. Find the mode of the following data: 120, 110, 130, 110, 120, 140, 130, 120, 140, 120
Solution. Let us first form the frequency table for the given data as given below:
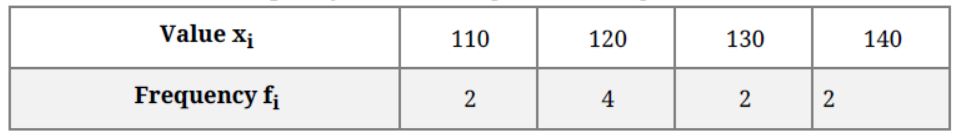
We observe that the value 120 has the maximum frequency.
Hence, the mode or modal values is 120.
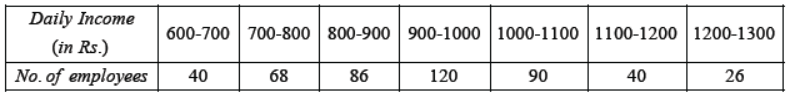
Question. Calculate the average daily income (in Rs) of the following data about men working in a company:
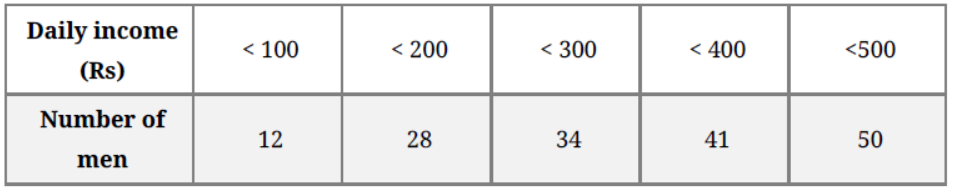
Solution.

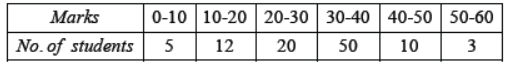
Question.

Find the median for the above frequency distribution.
Solution. n = 120
⇒ n/2 = 60
Median is average of 60th and 61st observation
Median = 5 + 5 /2 = 5
So, Median is 5.
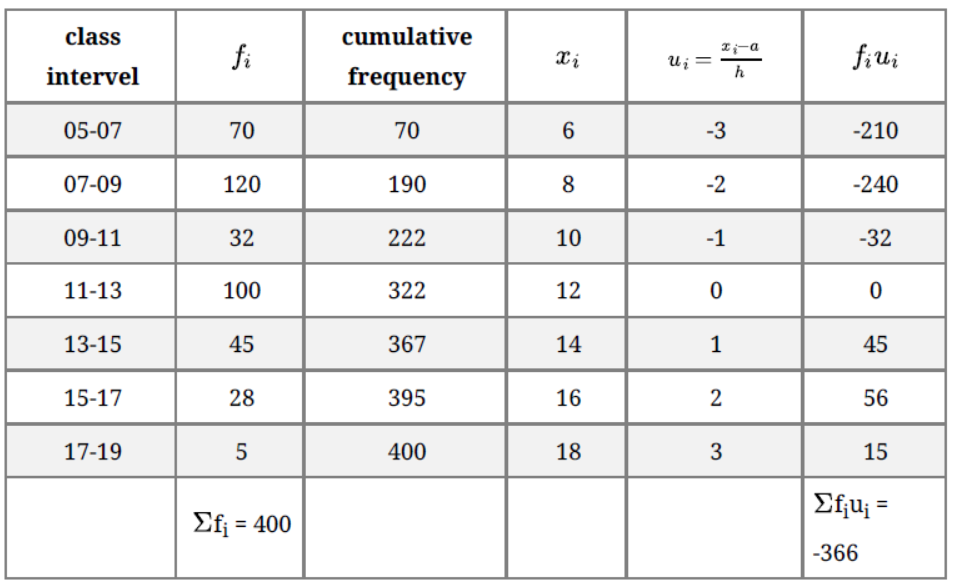
Question. Thirty women were examined in a hospital by a doctor and the number of heart beats per minute was recorded and summarized as follows. Find the mean heartbeats per minute for these women, choosing a suitable method.

Solution. Take a = 75.5, h = 3
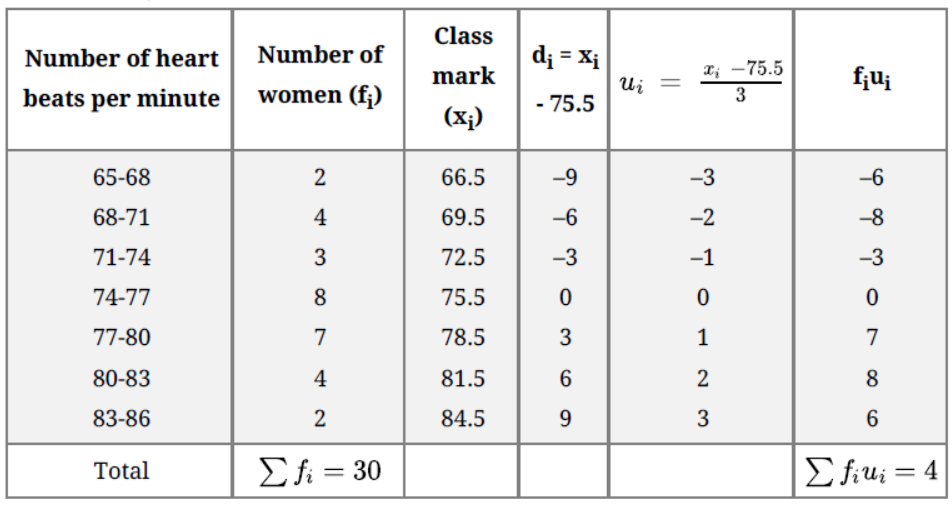
Using the step-deviation method,
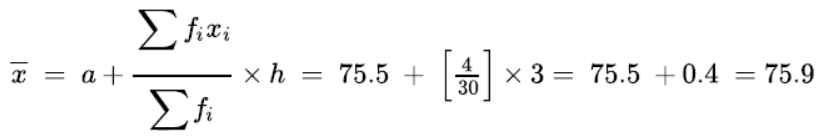
Hence, the mean heart beats per minute are 75.9.
Question. Calculate the median from the following data:
Solution.

Question. Find the unknown entries a, b, c, d in the following distribution of heights of students in a class :
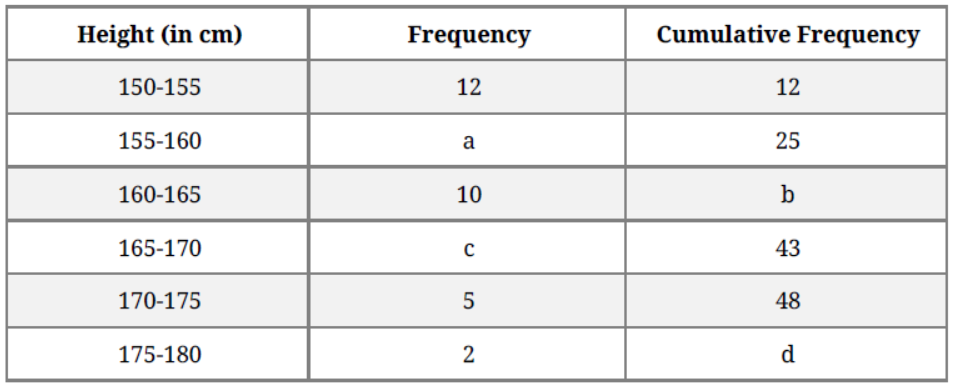
Solution.


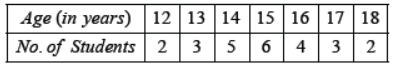
Question. On annual day of a school, 400 students participated in the function. Frequency distribution showing their ages is as shown in the following table :
Find mean and median of the above data.
Solution.
a= assumed mean = 12
we know that,

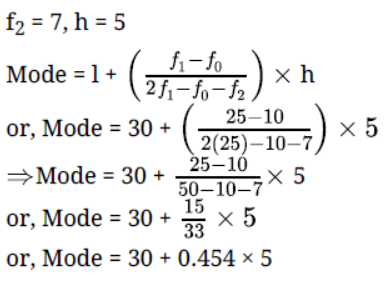
Question. The data regarding marks obtained by 48 students of a class in a class test is given below. Calculate the modal marks of students.
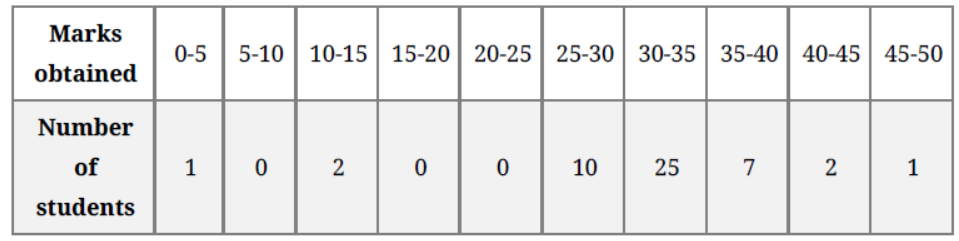
Solution. Modal class is 30 – 35, l =30, f1= 25, f0 = 10,
= 30 + 2.27 or 32.27 approx.
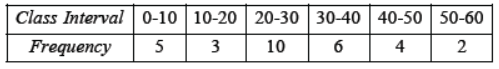
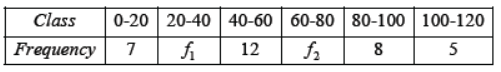
Question. The mean of the following frequency distribution is 62.8 and the sum of all the frequencies is 50. Compute the missing frequency f1and f2.
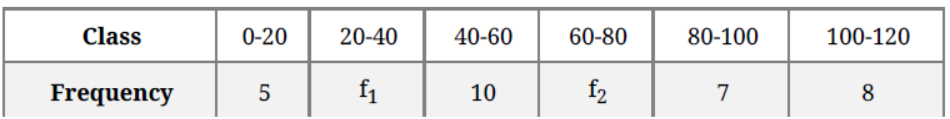
Solution. Given,
sum of frequency = 50
5 + f1 + 10 + f2 + 7 + 8 = 50
f1 + f2 = 20
3f1 + 3f2 = 60 … (1) [multiply both side by 3]
And mean = 62.8
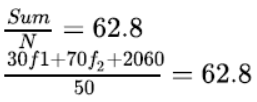
30f1 + 70f2 = 3140 – 2060
30f1 + 70f2 = 1080
3f1 + 7f2 = 108 …(2) [divide it by 10]
subtract equation (1) from equation (2)
3f1 + 7f2 – 3f1 – 3f2 =108 – 60
4f2 = 48
f2 =12
Put value of f2 in equation (1)
3f1 + 3(12) = 60
f1 = 24/3 = 8
f1 = 8, f2 = 12
Question. From the following frequency distribution, find the median class :
Solution.

Question. The arithmetic mean of the following data is 14. Find the value of k.
Solution.

Given

Question. Find the mode of the data , using a empirical formula , when it is given that median = 41.25 and mean = 33.75
Solution. We know , Mode = 3(Median) – 2(Mean)
Given, Median = 41.25 and Mean = 33.75
Therefore , Mode = 3 x 41.25 – 2 x 33.75
= 123. 75 – 67.50
= 56.25
So, mode is 56.25.
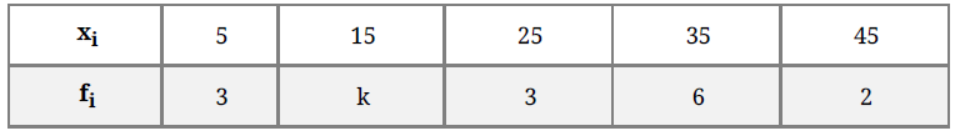
Question. The following distribution shows the daily pocket allowance given to the children of a multistorey building. The average pocket allowance is Rs.18.00. Find out the missing frequency.
Solution. Given mean = 18,
Let the missing frequency be ‘v’.


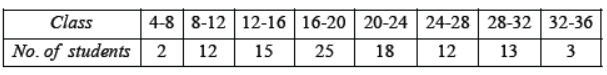
Question. The following table gives the number of children of 150 families in a village
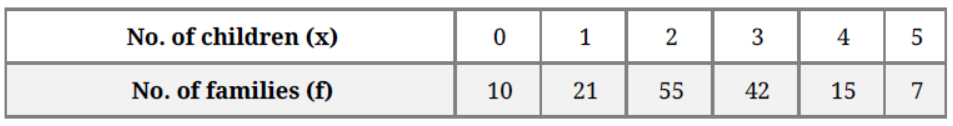
Find the average number of children per family.
Solution. Let the assumed mean (A) = 2
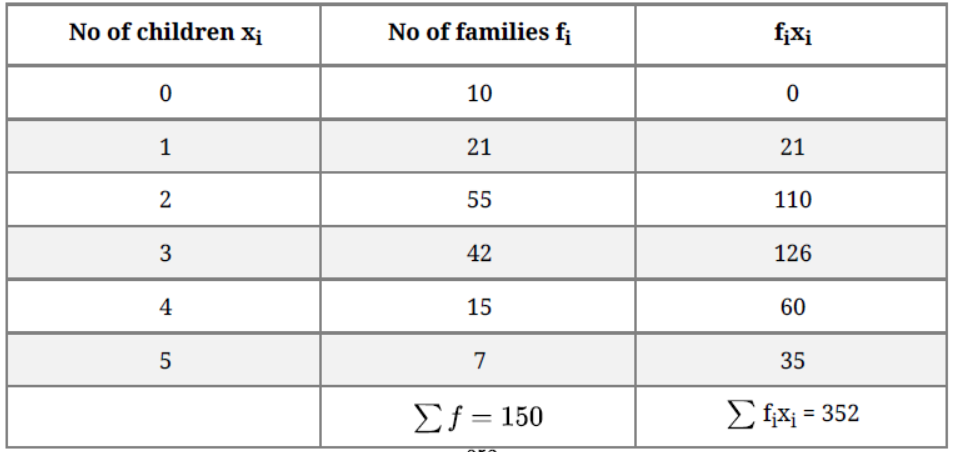
Average number of children per family = 352/150 = 2.35(approx)
Question. Find the mode of the following data: 25,16,19, 48,19, 20,34,15, 19, 20, 21, 24,19, 16, 22, 16 ,18, 20,16, 19 …….
Solution. Given, data
25,16,19, 48,19, 20,34,15, 19, 20, 21, 24,19, 16, 22, 16 ,18, 20,16,19
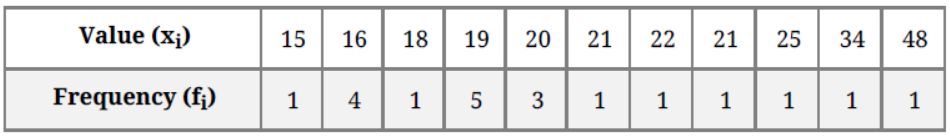
We observe that the value 19 has the maximum frequency i.e. 5.
Therefore, mode of the given data is 19.
Question. The arithmetic mean of the following data is 25, find the value of k.
Solution.
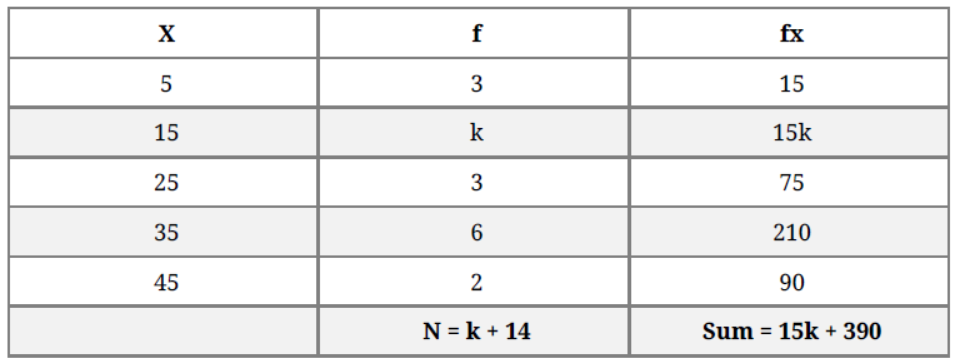
Given mean = 25
sum /N = 25
15k + 390 = 25k + 350
25k – 15k = 40
10k = 40
k = 4
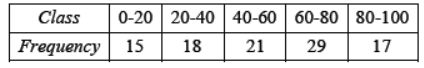
Question. Find the value of p for the following distribution whose mean is 16.6.
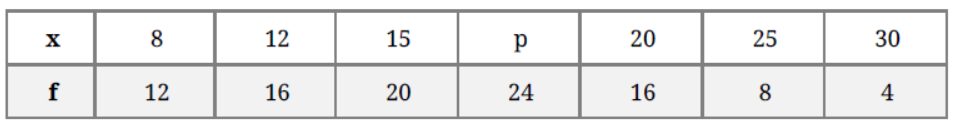
Solution.


Question. Calculate the median from the following data:
Solution.


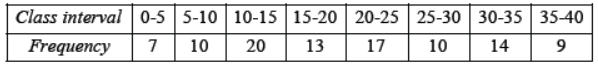
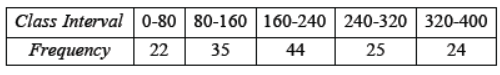
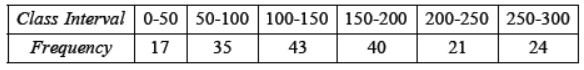
Question. Draw an ogive to represent the following frequency distribution:
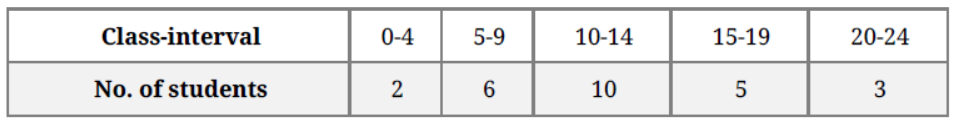
Solution. The given frequency distribution is not continuous, so we will first make it continuous and then prepare the cumulative frequency:
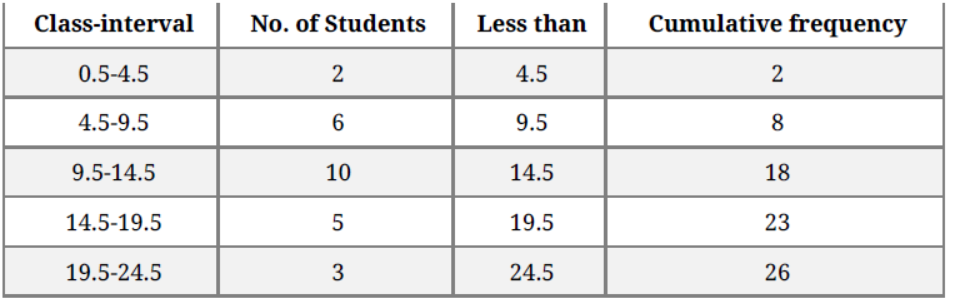
Plot the points (4.5, 2), (9.5, 8), (14.5, 18), (19.5, 23), (24.5,26) by taking the upper class limit over the x-axis and cumulative frequency over the y-axis.

Question. To find out the concentration of SO2 in the air (in parts per million, i.e., ppm), the data was collected for 30 localities in a certain city and is presented below:
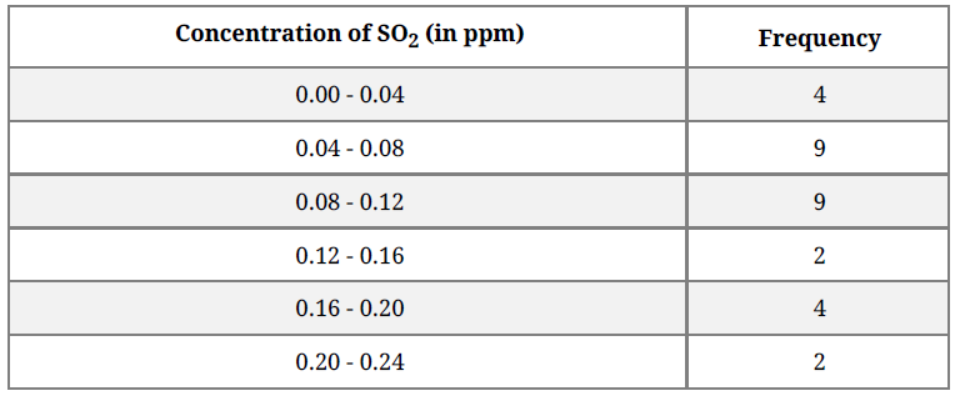
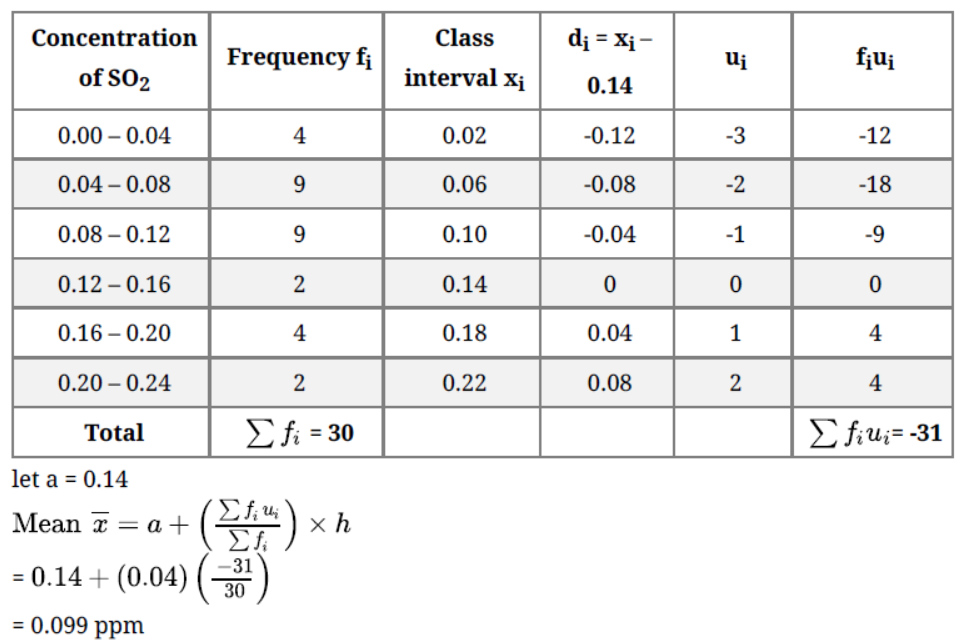
find the mean concentration of SO2 in the air.
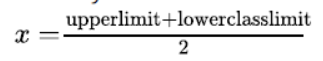
Solution. We may find class marks for each interval by using the relation
Class size of this data = 0.04
let a = 0.14
Question. Five coins were simultaneously tossed 1000 times, and at each toss the number of heads was observed. The number of tosses during which 0,1,2,3,4 and 5 heads were obtained are shown in the table below. Find the mean number of heads per toss
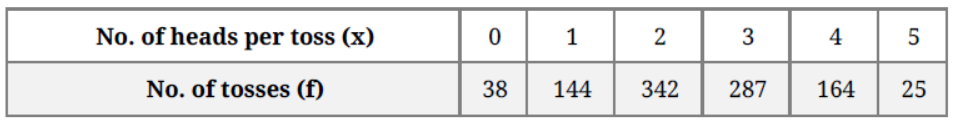
Solution. Let the assumed mean (A) = 2


Mean number of per toss = 2 + 470/1000 = 2 + 0.47 = 2.47
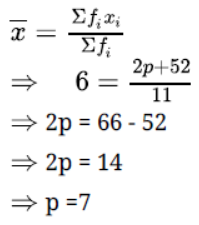
Question. If ∑fi = 11, ∑fixi = 2p + 52 and the mean of any distribution is 6, find the value of p.
Solution.
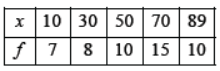
Question. Compare the modal ages of two groups of students appearing for an entrance test:
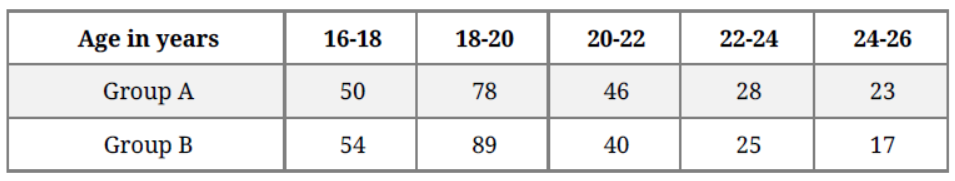
Solution.
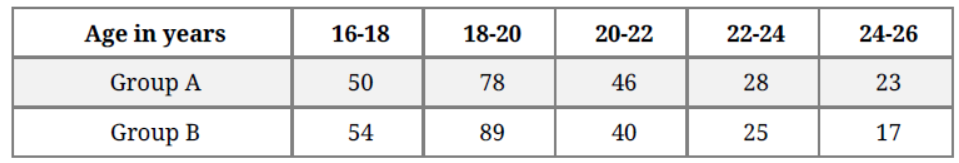
For Group A:
Here the maximum frequency is 78, then the corresponding class 18 – 20 is modal class.
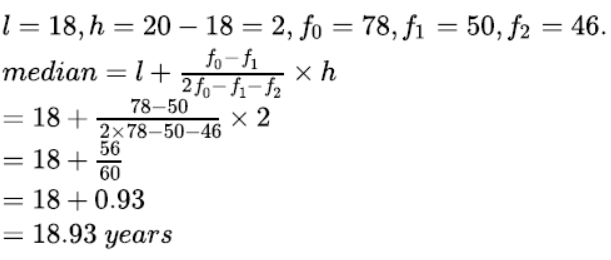
For group B:
Here the maximum frequency is 89, then the corresponding class 18 – 20 is the modal class.
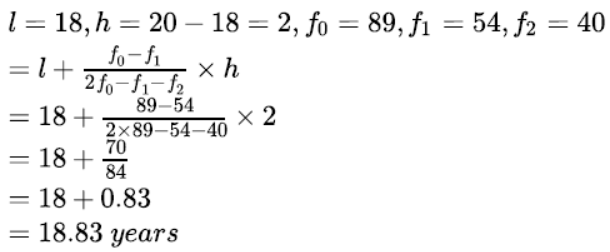
Hence the modal age for the Group A is higher than that for Group B.
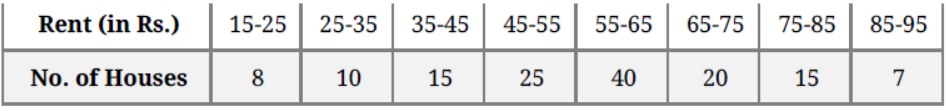
Question. The following distribution gives the daily income of 50 workers of a factory :
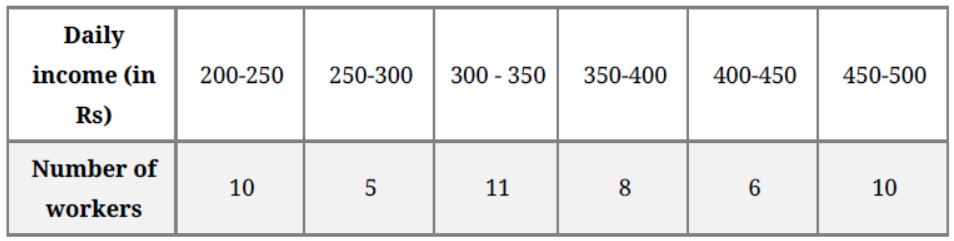
Convert the distribution to a ‘less than type’ cumulative frequency distribution and draw its ogive. Hence obtain the median of daily income.
Solution.
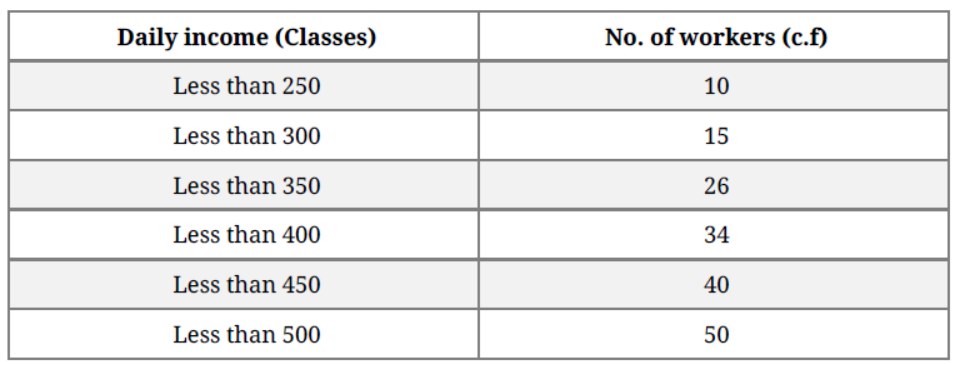

Hence, Median of daily income = Rs 345
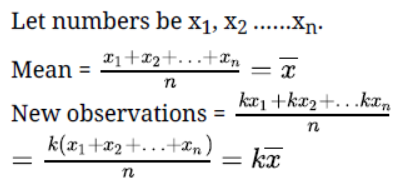
Question. The mean of a set of numbers is . If each number is multiplied by k, then find the mean of the new set.
Solution.
Question. Find the value of x, if the mode of the following data is 25: 15, 20, 25,18,14,15, 25,15,18,16, 20, 25, 20, x, 18
Solution. The frequency table of the given data is as given below:
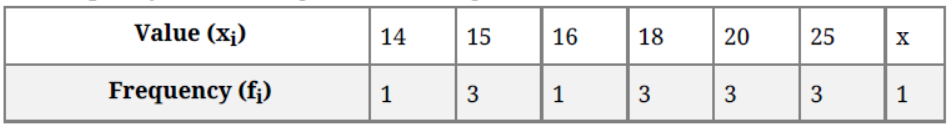
It is given that the mode of the given date is 25. So, it must have the maximum
frequency. That is possible only when x =25.
Hence, x = 25.
Question. The annual profits earned by 30 shops of a shopping complex in a locality are recorded in the table shown below:
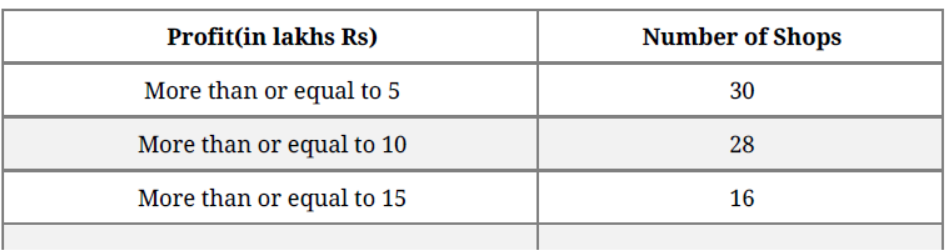

If we draw the frequency distribution table for the above data, find the frequency corresponding to the class 20-25.
Solution. The frequency table is as follows:
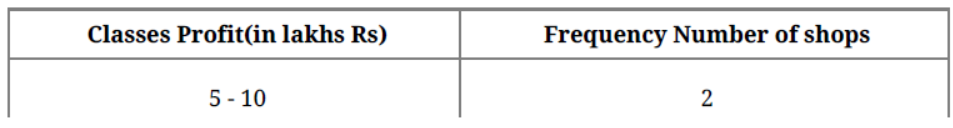

The frequency corresponding to the class 20 – 25 is 4. 12
Question. From the following information, construct less than and more than Ogive and find out median from it.
Solution.


Question. A set of numbers consists of four 5’s, six 7’s, ten 9’s, eleven 12’s, three 13’s, two 14’s. Find the mode of this set of numbers.
Solution. Mode = 12
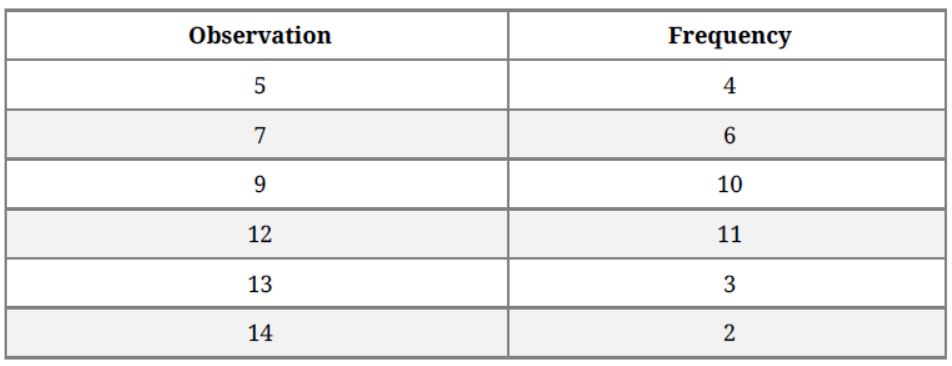
Since, It has highest frequency
Assignments for Class 10 Mathematics Statistics as per CBSE NCERT pattern
All students studying in Grade 10 Mathematics Statistics should download the assignments provided here and use them for their daily routine practice. This will help them to get better grades in Mathematics Statistics exam for standard 10. We have made sure that all topics given in your textbook for Mathematics Statistics which is suggested in Class 10 have been covered ad we have made assignments and test papers for all topics which your teacher has been teaching in your class. All chapter wise assignments have been made by our teachers after full research of each important topic in the textbooks so that you have enough questions and their solutions to help them practice so that they are able to get full practice and understanding of all important topics. Our teachers at https://www.assignmentsbag.com have made sure that all test papers have been designed as per CBSE, NCERT and KVS syllabus and examination pattern. These question banks have been recommended in various schools and have supported many students to practice and further enhance their scores in school and have also assisted them to appear in other school level tests and examinations. Its easy to take print of thee assignments as all are available in PDF format.
Some advantages of Free Assignments for Class 10 Mathematics Statistics
- Solving Assignments for Mathematics Statistics Class 10 helps to further enhance understanding of the topics given in your text book which will help you to get better marks
- By solving one assignments given in your class by Mathematics Statistics teacher for class 10 will help you to keep in touch with the topic thus reducing dependence on last minute studies
- You will be able to understand the type of questions which are expected in your Mathematics Statistics class test
- You will be able to revise all topics given in the ebook for Class 10 Mathematics Statistics as all questions have been provided in the question banks
- NCERT Class 10 Mathematics Statistics Workbooks will surely help you to make your concepts stronger and better than anyone else in your class.
- Parents will be able to take print out of the assignments and give to their child easily.
All free Printable practice assignments are in PDF single lick download format and have been prepared by Class 10 Mathematics Statistics teachers after full study of all topics which have been given in each chapter so that the students are able to take complete benefit from the worksheets. The Chapter wise question bank and revision assignments can be accessed free and anywhere. Go ahead and click on the links above to download free CBSE Class 10 Mathematics Statistics Assignments PDF.
Free PDF download of Statics Class 10 Maths Assignment Chapter wise pdf created by master educators from the latest syllabus of CBSE Boards. By practicing these Maths Assignment for Class 10 Chapter Wise PDF will help you to score more marks in your CBSE Board Examinations. We also give free NCERT Solutions and other study materials for students to make their preparation better.
Students who are searching for better solutions can download the Statics Class 10 Maths Assignment Chapter wise pdf with answers to assist you with revising the whole syllabus and score higher marks in your exam.
This Statics Class 10 Maths Assignment Chapter wise pdf shows up with an answer key with step-by-step answers for students to comprehend the problem at each level and not retain it.

You can download free assignments for class 10 Mathematics Statistics from https://www.assignmentsbag.com
You can get free PDF downloadable assignments for Grade 10 Mathematics Statistics from our website which has been developed by teachers after doing extensive research in each topic.
On our website we have provided assignments for all subjects in Grade 10, all topic wise test sheets have been provided in a logical manner so that you can scroll through the topics and download the worksheet that you want.
You can easily get question banks, topic wise notes and questions and other useful study material from https://www.assignmentsbag.com without any charge
Yes all test papers for Mathematics Statistics Class 10 are available for free, no charge has been put so that the students can benefit from it. And offcourse all is available for download in PDF format and with a single click you can download all assignments.
https://www.assignmentsbag.com is the best portal to download all assignments for all classes without any charges.