Please refer to The Theory of Firm Under Perfect Competition Class 12 Economics Important Questions with solutions provided below. These questions and answers have been provided for Class 12 Economics based on the latest syllabus and examination guidelines issued by CBSE, NCERT, and KVS. Students should learn these problem solutions as it will help them to gain more marks in examinations. We have provided Important Questions for Class 12 Economics for all chapters in your book. These Board exam questions have been designed by expert teachers of Standard 12.
Class 12 Economics Important Questions The Theory of Firm Under Perfect Competition
Short Answer Type Questions:
Question. A firm supplies a certain quantity of a good at a price of Rs 10 per unit. When price changes to Rs 9 per unit, the firm supplies 10 units less. Price elasticity of supply is 1. What is the quantity supplied before price change?
Ans. P = Rs 10, P1 = Rs 9
ΔP = 9 − 10 = (−)Rs 1 ⇒ Q = ?, ΔQ = − 10 ⇒ Es = 1
Now, Price Elasticity of Supply (Es ) = ΔQ / ΔP × P / Q
1= -10 / -1 x 10 / Q ⇒ Q = 100
∴ Quantity supplied before price change = 100 units
Question. Explain the situation of zero elasticity of supply with the help of a diagram.
Ans. It refers to a vertical straight line supply curve showing constant supply. It is shown in the given figure

In such a situation, it is assumed that supply is constant, whatever the changes in price.
Question. Using diagram and schedule, explain the law of supply.
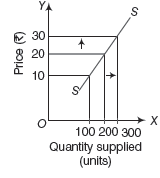
Ans. The law of supply states that other things being equal, quantity supplied increases with the increase in price and decreases with the decrease in price of a commodity. It can be explained with the help of following schedule and diagram
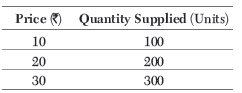
The supply schedule shows the positive relationship between price and quantity supplied. This is in accordance with the law of supply.
SS is the supply curve sloping upward. It shows a positive relationship between price and quantity supplied of a commodity. When price increases from Rs 10 to Rs 20, quantity supplied increases from 100 to 200 units.
Question. A firm supplies 10 units of a good at a price of Rs 5 per unit. Price Elasticity of Supply is 1.25. What quantity will the firm supply at a price of Rs 7 per unit?
Ans. Given, Es = 1.25, P = Rs 5
P1 = Rs 7, Q=10
Q1 =?,
ΔP = P1 − P = 7 – 5 = 2
Price Elasticity of Supply (Es ) = ΔQ / ΔP × P / Q
1.25 = ΔQ / 2 × 5 / 10 = ΔQ = 1.25 × 4 = 5
Q1 = Actual Quantity + Change in Quantity
= Q+ ΔQ = 10 + 5
Q1 =15 units
Question. Explain, how input prices are a determinant of supply of a good by a firm.
Ans. In case of increase in input price, cost of production tends to rise. Accordingly, producers will supply less of he commodity at its existing price as there is a decrease in producer’s profit. On the other hand, in case of fall in the prices of inputs, the cost of production tends to fall, leading to an increase in producer’s profit. This induces him to increase his supply.
Question. Explain any two factors that cause a shift of supply curve.
Ans. Two factors that cause a shift of supply curve are
(i) Change in Technology Technological improvement tends to lower the marginal and average costs of production because better technology facilitates higher output with the same inputs. Accordingly, producers are willing to supply more at the existing price. This implies a rightward shift in supply curve and vice-versa.
(ii) Change in Input Price Input price may increase or decrease. In case of increase in input price, marginal and average costs tend to rise. Accordingly, producers will supply less of the commodity at its existing price. This implies a leftward shift in supply curve and vice-versa.
Question. Price of commodity A is Rs 10 per unit and Total Revenue at this price is Rs 1,600. When its price rises by 20%, total Revenue increases by Rs 800. Calculate its price elasticity of supply.
Ans. Given, P = Rs 10,
P1 = 10 + 20% of 10
= 10 + 2 = Rs12
Initial Total Revenue = Rs 1,600
New Total Revenue = 1,600 + 800 = Rs 2,400
When, P = Rs 10, Q = 1,600 ÷ 10 = 160
When, P1 = Rs 12, Q1 = 2 ,400 ÷ 12 = 200
Now, P = Rs 10, P1 = Rs 12
ΔP =12−10= Rs 2 ,
Q =160, Q1 =200
ΔQ = 200 − 160 = 40
Price Elasticity of Supply (Es ) = ΔQ / ΔP × P / Q
= 40 / 2 x 10 / 160
= 5 / 4 = 1.25
∴ Price Elasticity of Supply
(Es ) = 1.25 (more than unit elastic)
Question. State any three causes of rightward shift in supply curve.
Ans. Causes of rightward shift in supply curve are as follows (any three)
(i) Fall in the price of substitute goods.
(ii) Fall in the price of factors of production.
(iii) Improvement in technology.
(iv) Increase in the number of firms in the market.
(v) Rise in the price of complementary goods.
Question. When the price of a good rises from Rs 20 per unit to Rs 30 per unit, the revenue of the firm producing this good rises from Rs 100 to Rs 300. Calculate price elasticity of supply.
Ans. Given,
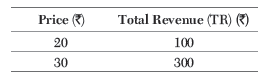
Quantity Supplied (Q) = TR / P = 100 / 20 = 5
Q1 = 300 / 30 =10
So, P = 20
Q = 5
P1 = 30
Q1 =10
ΔP = P1 − P = 30 – 20 =10
ΔQ= Q− Q = 10 − 5 = 5
Price Elasticity of Supply (Es ) = ΔQ / ΔP × P / Q = 5 / 10 x 20 / 5
∴ Es = 2 (more than unit elastic)
Question. At a price of Rs 5 per unit of a commodity A, total revenue is Rs 800. When its price rises by 20%, total revenue increases by Rs 400. Calculate its price elasticity of supply.
Ans. Given, P = Rs 5, Initial Total Revenue = Rs 800
P1 = 5 + 20% of 5 = 5 + 1 = Rs 6
New Total Revenue = 800 + 400 = Rs 1,200
Q= 800 ÷ 5 = 160
Q1 = 1,200 ÷ 6 = 200
ΔQ = Q1 − Q = 200 – 160 = 40
ΔP = P1 − P = 6- 5 = Rs 1
Price Elasticity of Supply (Es ) = ΔQ / ΔP × P / Q
= 40 / 1 x 5 / 160 = 5 / 4 = 1.25
∴ Es = 1.25 (more than unit elastic)
Question. Explain, how technological progress is a determinant of supply of a good by a firm.
Ans. Technological progress tends to lower the Marginal and Average Costs of production, because better technology facilitates higher output with the same inputs. Accordingly, producers are willing to supply more at the existing price, as a result, supply of producer increases.
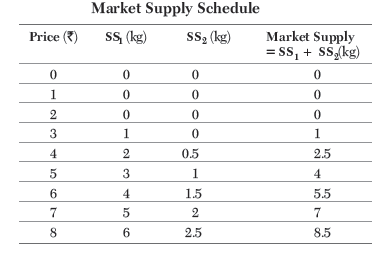
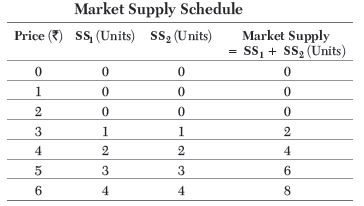
Question. Consider a market with two firms. In the following table, columns labelled as SS1 and SS2 give the supply schedules of firm 1 and firm 2, respectively. Compute the market supply schedule.
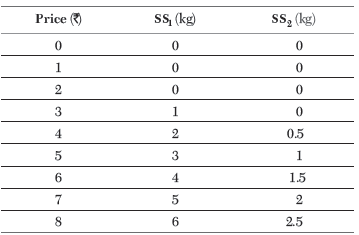
Ans.
Question. (i) Explain the effect of rise in input prices on supply of a commodity.
(ii) Explain the effect of fall in prices of inputs on the supply of a good.
Ans. (i) In case of increase in input price, marginal cost tends to rise. Accordingly, producers will supply less of the commodity at its existing price because of a fall in their profits.
(ii) In case of fall in input price, marginal cost will decline. Accordingly, producer will supply more of the commodity at its existing price because of increase in their profits.
Question. When the price of a commodity rises from Rs 10 to Rs 11 per unit, its quantity supplied rises by 100 units. Its price elasticity of supply is 2. Calculate its quantity supplied at the increased price.
Ans. Given, P = Rs 10
P1 = Rs 11
ΔP = 11 − 10 = Rs 1
Q = ?
ΔQ = 100 units, Es = 2
Price Elasticity of Supply
(Es ) = ΔQ / ΔP × P / Q or 2 = 100 / 1 x 10 / Q,
Q = 100 × 10 / 2 = 500
∴ Quantity supplied at the increased price
(Q1 ) Q + ΔQ = 500 + 100 = 600 units
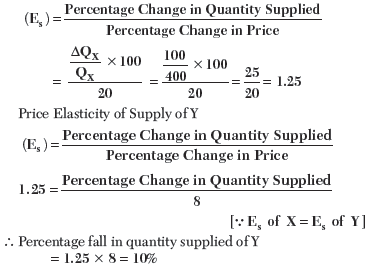
Question. Commodities X and Y have equal Price Elasticity of Supply. The supply of X rises from 400 units to 500 units due to a 20% rise in its price. Calculate the percentage fall in supply of Y if its price falls by 8%.
Ans. Given, Es of X = Es of Y
QX = 400, Q’X = 500
Percentage change in price of X = 20%
Percentage change in price of Y = 8%
ΔQX =Q’X – QX
= 500 − 400 = 100 units
Price Elasticity of Supply of X
Question. Consider a market with two firms. The following table shows the supply schedules of the two firms. The SS1 column gives the supply schedule of firm 1 and the SS2 column gives the supply schedule of firm 2. Compute the market supply schedule.
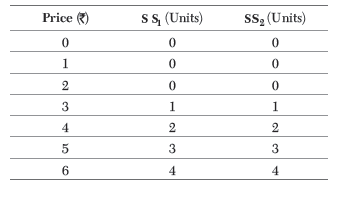
Ans.
Long Answer Type Questions:
Question. (i) Distinguish between change in supply and change in quantity supplied. Which of these causes a shift of supply curve?
(ii) Distinguish between movement along the supply curve and shift in the supply curve with the help of a suitable diagram.
Ans. (i) Difference between change in supply and change in quantity supplied
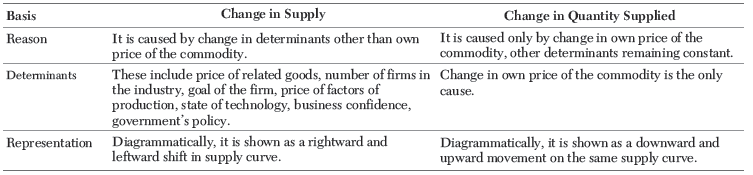
(ii) Difference between movement along the supply curve and shift in the supply curve

Question. Explain the meaning of increase in supply and increase in quantity supplied with the help of a schedule.
Ans. Increase in SupplyWhen supply of a commodity increases due to favourable changes in factors other than price, it is called increase in supply.
In this situation, supply curve shifts to the right side. It can be explained with the help of an imaginary schedule
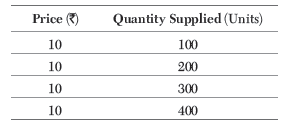
As, it is clear from the above schedule that supply is increasing at constant prices.
Increase in Quantity Supplied When supply of a commodity increases due to increase in price of a commodity and other factors remaining constant, it is called increase in quantity supplied. In this situation, supply curve moves upward. It can be explained with the help of an imaginary schedule
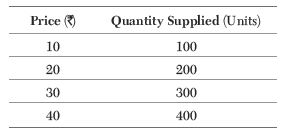
Here, we can see that quantity supplied is rising with rise in prices.
Question. Explain how changes in prices of other products influence the supply of a given product.
Ans. As resources have alternative uses, the quantity supplied of a commodity depends not only on its price, but also on the prices of other commodities.
Increase in the prices of substitute goods makes them more profitable in comparison to the given commodity. As a result, the firm shifts its limited resources from production of the given commodity to production of other goods. e.g. increase in the price of wheat will induce the farmer to use land for cultivation of wheat in place of rice.
Decrease in price of substitute good will shift the supply curve to the right and vice-versa.
In case of complementary goods, if price of one good increases, then supply of its complementary good also increases, conveying a direct relationship. So, rise in the price of car, will cause the supply of petrol to also rise and the supply curve shifts to the rightward ad vice-versa.
Question. Using diagrams, explain various degrees of price elasticity of supply.
Ans. The various degrees of price elasticity of supply are given below
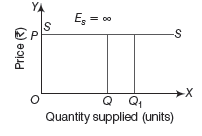
(i) Perfectly Elastic Supply In this case, a slight change in price causes infinite change in quantity supplied. The supply curve SS is parallel to X-axis and Es = ∞, as shown in the figure
(ii) Perfectly Inelastic Supply It is a situation where the quantity supplied remains unchanged, whatever be the changes in price. Hence, the supply curve is parallel to Y-axis and Es = 0, as shown in the figure

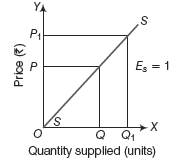
(iii) Unitary Elastic Supply In this case, percentage change in quantity supplied is exactly equal to percentage change in price. Hence, the supply curve is a straight line originating from the origin and sloping upward and Es= 1, as shown in the figure
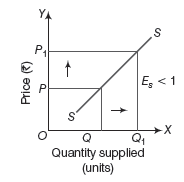
(iv) More than Unitary Elastic Supply In this situation, percentage change in quantity supplied is greater than the percentage change in price.
An upward sloping straight line supply curve originates from Y-axis and Es >1, as shown in the figure

(v) Less than Unitary Elastic Supply In this situation, percentage change in quantity supplied is less than percentage change in price. An upward sloping straight line supply curve originates from X-axis and Es <1, as shown in the figure