Please refer to Assignments Class 11 Economics Measures of Dispersion Chapter 1 with solved questions and answers. We have provided Class 11 Economics Assignments for all chapters on our website. These problems and solutions for Chapter 1 Measures of Dispersion Class 11 Economics have been prepared as per the latest syllabus and books issued for the current academic year. Learn these solved important questions to get more marks in your class tests and examinations.
Measures of Dispersion Assignments Class 11 Economics
Dispersion refers to the variation of the items around an average.
Objectives of Dispersion
a) To determine the reliability of an average.
b) To compare the variability of two or more series.
c) It serves the basis of other statistical measures such as correlation etc.
d) It serves the basis of statistical quality control.
Properties of good measure of Dispersion
a) It should be easy to understand.
b) Easy to calculate.
c) Rigidly defined
d) Based on all observations.
e) Should not be unduly affected by extreme values.
Measures of Dispersion may be either absolute measures or relative measure.
Absolute Measures of Dispersion are
a) Range
b) Quartile Deviation
c) Mean Deviation
d) Standard Deviation
Relative Measures of Dispersion are
a) Coefficient of Range
b) Coefficient of Quartile Deviation
c) Coefficient of Mean Deviation
d) Coefficient of Variation
Graphical method of dispersion
Lorenz Curve
Range
It is the difference between the largest and smallest value of distribution.
Computation of Range
Range = L – S
Coefficient of Range = (L-S)/(L+S)
Merits of Range
1. It is simple to understand and easy to calculate.
2. It is widely used in statistical quality control.
Demerits of Range
1. It is affected by extreme values in the series.
2. It cannot be calculated in case of open end series.
3. It is not based on all items.
Inter quartile range and quartile deviation
Inter quartile range is the difference between Upper Quartile (Q3) and Lower Quartile Q1.
Quartile deviation is half of inter quartile range.
Computation of Inter quartile range and quartile deviation
Inter quartile Range = Q3 – Q1
Quartile Deviation Q.D = (Q3 – Q1)/2
Coefficient of Q.D = (Q3 – Q1)/Q3 + Q1
Merits of Q.D
1. Easy to compute
2. Less affected by extreme values.
3. Can be computed in open ended series.
Demerits of Q.D
1. Not based on all observations
2. It is influenced by change in sample and suffers from instability.
Mean Deviation
Mean Deviation is defined as the arithmetic average of the absolute deviations [ignoring signs] of various items from Mean or Median.
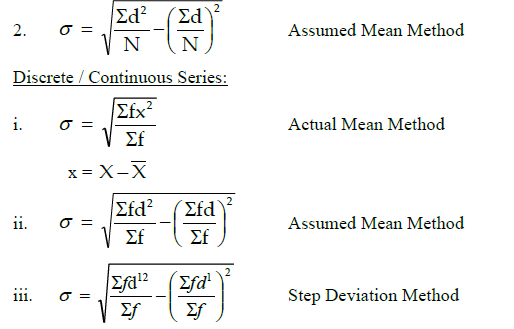
Computation of Mean Deviation
Individual Series

Discrete/Continuous Series

Merits of Mean Deviation
1. Based on all observations.
2. It is less affected by extreme values.
3. Simple to understand and easy to calculate.
Demerits of Mean Deviation
1. It ignores ± signs in deviations.
2. It is difficult to compute when deviations comes in fractions.
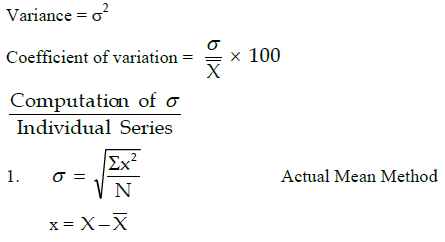
Standard Deviation: (σ)
It is defined as the root mean square deviation.
Features of Standard Deviation:
1. Value of its deviation is taken from Arithmetic Mean.
2. + and – signs of deviations taken from mean are not ignored.
Related Measures of Standard Deviation
Standard deviation = σ
Coefficient of standard deviation:

Merits of Standard Deviation
i. Rigidly defined
ii. Based on all observations
iii. Takes Algebraic signs in consideration
iv. Amenable to further Algebraic treatment
Demerits
i. Difficult to understand and compute.
ii. Affected by extreme items.
Lorenz Curve
It is a graphical method of studying dispersion.
Lorenz curve is a cumulative percentage curve in which the percentage of frequency is combined with percentage of other items such as profit, income etc.

