Please refer to MCQ Questions Chapter 13 Statistics Class 10 Mathematics with answers provided below. These multiple-choice questions have been developed based on the latest NCERT book for class 10 Mathematics issued for the current academic year. We have provided MCQ Questions for Class 10 Mathematics for all chapters on our website. Students should learn the objective based questions for Chapter 13 Statistics in Class 10 Mathematics provided below to get more marks in exams.
Chapter 13 Statistics MCQ Questions
Please refer to the following Chapter 13 Statistics MCQ Questions Class 10 Mathematics with solutions for all important topics in the chapter.
MCQ Questions Answers for Chapter 13 Statistics Class 10 Mathematics
Question. Which of the following is true –
(a) Mode = 3Median + 2Mean
(b) Median = Mode + [Mean – Median]
(c) Mean = Mode + [Median – Mode]
(d) Median = Mode + [Median + Mode]
Answer
C
Question. The measure of central tendency which is given by the x-coordinate of the point of intersection ofthe ‘more than’ ogive and ‘less than’ ogive is –
(a) Mean
(b) Median
(c) Mode
(d) None of these
Answer
B
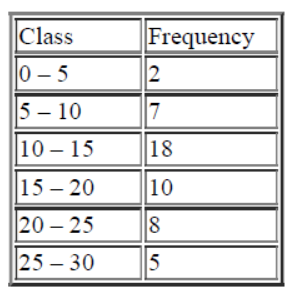
Question. For the following distribution:

The modal class is
(a) 0-20
(b) 20-30
(c) 30-40
(d) 50-60
Answer
C
Question. Consider the following frequency distribution of the heights of 60 students of a class
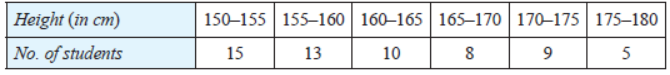
The upper limit of the median class in the given data is
(a) 165
(b) 155
(c) 160
(d) 170
Answer
A
Question. The cumulative frequency of a given class is obtained by adding the frequencies of all the classes
(a) preceding it
(b) succeeding it
(c) Both (a) and (b)
(d) None of these
Answer
A
Question. While computing mean of grouped data, we assume that the frequencies are
(a) evenly distributed over all the classes
(b) centred at the classmarks of the classes
(c) centred at the upper limits of the classes
(d) centred at the lower limits of the classes
Answer
B
Question. In a data, if I = 40, h = 15, f 1 =7, f 0 =3, f 2 =6, then the mode is
(a) 52
(b) 62
(c) 72
(d) none of these
Answer
A
Question. Mean of 100 items is 49. It was discovered that three items which should have been 60, 70, 80were wrongly read as 40, 20, 50 respectively. The correct mean is
(a) 48
(b) 49
(c) 50
(d) 60
Answer
C
Question. Mode is the
(a) middle most frequent value
(b) least frequent value
(c) maximum frequent value
(d) none of these
Answer
C
Question. The mean and the median of a distribution are 45.9 and 46 respectively. The mode will be
(a) 45
(b) 47
(c) 48
(d) 46.2
Answer
D
Question. The mean of the first 10 natural numbers is
(a) 5
(b) 6
(c) 4.5
(d) 5.5
Answer
D
Question. Which of the following is true?
(a) Mode = 2Median – Mean
(b) Mode = 3Median + 2Mean
(c) Mode = 3Median – 2Mean
(d) None of these
Answer
C
Question. The median of first 10 prime numbers is
(a) 11
(b) 12
(c) 13
(d) none of these
Answer
B
Question. The mean of the first 10 multiples of 6 is
(a) 3.3
(b) 33
(c) 34
(d) none of these
Answer
B
Question. Which of the following can not be determined graphically?
(a) Mean
(b) Median
(c) Mode
(d) None of these
Answer
A
Question. For a symmetrical distribution, which is correct
(a) Mean > Mode > Median
(b) Mode = Mean+Median/2
(c) Mean < Mode < Median
(d) Mean = Median = Mode
Answer
D
Question. Construction of a cumulative frequency table is useful in determining the
(a) mean
(b) median
(c) mode
(d) all of the above
Answer
B
Question. The age of 18 students of a class is reported below. Their modal age is 10, 17, 14, 10, 11, 12, 12,13, 17, 13, 14, 14, 15, 16, 17, 15, 17, 16
(a) 22 years
(b) 17 years
(c) 14 years
(d) 16 years
Answer
B
Question. The wickets taken by a bowler in 10 cricket matches are 2, 6, 4, 5, 0, 3, 1, 3, 2, 3. The mode of thedata is
(a) 1
(b) 2
(c) 3
(d) 4
Answer
C
Question. While computing mean of a grouped data, we assume that the frequencies are
(a) centered at the lower limits of the classes
(b) centered at the upper limits of the classes
(c) centered at the class marks of the classes
(d) evenly distributed over all the classes
Answer
C
Question. The mode of 4, 5, 6, 8, 5, 4, 8, 5, 6, x, 8 is 8. The value of ‘x’ is
(a) 4
(b) 5
(c) 6
(d) 8
Answer
D
Question. In the given data if n = 230, I = 40, cf = 76, h = 10, f = 65, then its median is
(a) 40
(b) 46
(c) 47
(d) 48
Answer
B
Question. The marks obtained by 9 students in Mathematics are 59, 46, 30, 23, 27, 44, 52, 40 and 29. Themedian of the data is
(a) 30
(b) 35
(c) 29
(d) 40
Answer
D
Question. For the following frequency distribution:
If the mode and the median are 12.9 and 14.44 respectively, then the mean is
(a) 15.2
(b) 13
(c) 16
(d) 17
Answer
A
Question. If the arithmetic mean of n numbers of a series is x and the sum of first (n – 1) numbers is k, the value of the last number is
(a) n¯x – k
(b) n‾x + k
(c) ¯x + k/n
(d) n( ¯x + k)
Answer
A
Question. Arithmetic mean of all factors of 20 is
(a) 5
(b) 6
(c) 7
(d) 8
Answer
C
Question. The mean of 5 numbers is 27. If one number is excluded their mean is 25. The excluded number is
(a) 30
(b) 35
(c) 32
(d) 36
Answer
B
Question. While computing mean of grouped data, we assume that the frequencies are
(a) evenly distributed over all the classes
(b) centered at the classmarks of the classes
(c) centered at the upper limits of the classes
(d) centered at the lower limits of the classes
Answer
B
Question. If xi are the mid-points of the class intervals of grouped data, fis are the corresponding frequencies and x is the mean, then S( fixi – x) is equal to
(a) 0
(b) –1
(c) 1
(d) 2
Answer
A
Question. In the following x = A + (∑fi di/∑fi) for finding the mean of grouped frequency distribution, di =
(a) xi + A
(b) A – xi
(c) xi – A
(d) A − xi/fi
Answer
C
In the following questions, a statement of assertion (A) is followed by a statement of reason (R). Mark the correct choice as:
(a) Both assertion (A) and reason (R) are true and reason (R) is the correct explanation of assertion (A).
(b) Both assertion (A) and reason (R) are true but reason (R) is not the correct explanation of assertion (A).
(c) Assertion (A) is true but reason (R) is false.
(d) Assertion (A) is false but reason (R) is true.
Question. Assertion (A): To find mean of a grouped data, we use x a + ∑fi di/∑fi where a is the assumed mean and di the deviation.
Reason (R): To find deviation, we use di = a – xi where a is the assumed mean and xi is the class mark.
Answer
C
(a) If both Assertion and Reason are correct and Reason is the correct explanation of Assertion.
(b) If both Assertion and Reason are correct, but Reason is not the correct explanation of Assertion.
(c) If Assertion is correct but Reason is incorrect.
(d) If Assertion is incorrect but Reason is correct.
Question. Assertion : If the number of runs scored by 11 players of a cricket team of India are 5, 19, 42, 11, 50, 30, 21, 0, 52, 36, 27 then median is 30.
Reason : Median = (n + 1/2) th value, if n is odd.
Answer
D
Question. Assertion : If the value of mode and mean is 60 and 66 respectively, then the value of median is 64.
Reason : Median = 1/ 2 (mode + 2 mean).
Answer
C
Question. Assertion : The arithmetic mean of the following given frequency distribution table is 13.81.
Reason : ¯x = ∑ fi xi / ∑fi .
Answer
A

We hope you liked the above provided MCQ Questions Chapter 13 Statistics Class 10 Mathematics with solutions. If you have any questions please ask us in the comments box below.